


What are your Instagram followers really saying?
I’m sure you’re talking to your audience and hopefully, some of them are replying (in the comments), but this doesn’t tell you the full story.
A 2018 report tells us that the average engagement rate on Instagram is between 1-3% (Scrunch.com). So, what is the other 97% of your audience thinking? How can you find out?
The key to discovery: Instagram Analytics.
There are a number of amazing Instagram analytics tools out there, but for the purposes of this article, we’re going to focus on the ‘Insights’ tab (and how to use this amazing data). If you’ve never used it before, and you haven’t used properly the tools to analyze data yet, it’s like stepping through the looking glass.
SEE MORE: 24 Instagram Marketing Tools You Need To Check
Within this wonderful stat filled world, you can track, analyze and optimize your Instagram campaigns…
…and in this post, I’m going to show you how to use your Instagram Analytics to boost your engagement rate, conduct an Instagram audit, grow your following, and become an all-around social media gangster.
Sound good?
Let’s twist our caps to the side and get a serious swag on.
Contents
What’s Instagram analytics?
Instagram analytics is the best way to see all the analytics of your Instagram account about all the followers, posts, activity, and engagement. Analytics are a marketer’s best friend. They’re our guide, our roadmap, our GPS system. It doesn’t matter if you’re a brand, influencer, or a social media manager, you need to embrace the numbers like a seasoned marketing expert.
SEE MORE: Top Social Media Influencers To Follow In 2020
Ignoring your Instagram analytics is like driving with a blindfold on.
The numbers in your analytics will give you direction.
Read that again. It’s crucial that you understand just how important that sentiment is.
When you understand your audience, content, and the overall activity on your Instagram profile, you can accurately plan a road to your promised land.
But, what exactly does your promised land look like?
I’ve seen a lot of guides about Instagram Analytics. They explain how to find the all-important numbers and some even reveal strategies that will help you achieve better metrics, but (almost) all of them have a big gap…
…how it relates to you.
Why track Instagram analytics?
It’s all well and good when you know your numbers, but if you don’t start in Instagram Analytics with an idea of what matters, you might as well look at a blank spreadsheet.
You need to have clear goals, objectives, a reason for taking the time to analyze.
In the world of business and marketing, we call these trackable aims KPI’s. Before you follow the rest of this guide, I want you to use one (or a mixture) of the three following goals to create a short list of KPIs that are relevant to your Instagram objectives.
When you understand these and how they relate to Instagram Analytics, you can use the data to formulate effective strategies.
Which one of these objectives means the most to you?
Growth
Is your ultimate aim to grow a massive audience? Do you want to reach as many people as possible? Are you hoping to spread a message? Are you a new brand seeking social proof and a wider reach?
Particularly relevant to: Start-ups and emerging brands.
Growth KPIs:
- Feed Post Impressions
- Hashtag Impressions
- -Follower count
- -Profile Visits
- -Reach
SEE MORE: Instagram Growth Techniques Of Super Stars – Get Your First 10K Followers
Community Development
Do you want your audience to hang on your every word? Would you like to have every single one of your followers actively engaged with your content? Are you aiming to create a community around your profile? Would you like to receive tons of comments and likes?
Particularly relevant to: Instagram influencers and businesses in ultra-specific niches.
Community Development KPIs:
- Comments
- Likes
- Engagement rate
- Direct messages
- Follower stability
Business Growth
Are you hoping to use Instagram to grow your business? Would you like more website clicks? Are you using Instagram as a selling platform? Do you want to receive emails and generate leads?
Particularly relevant to: Established brands with large audiences.
Business Growth KPIs:
- Website clicks
- Emails
- Calls
- Profile Visits
- Followers
These are the three main brand aims when using Instagram. Which one suits you best?
Don’t worry if there’s a slight overlap in your objectives. You can aim for more than one (it just takes more time to track and optimize).
When you’re happy with your choices and mapping of objectives, make a note of your KPIs and brace yourself as we step into the world of Instagram Analytics.
SEE MORE: The Hidden Features Of Instagram And How They’ll Help You
Where and how to track Instagram analytics?
In order for you to track your Instagram Analytics, you must first have a Business Account, but don’t worry if you’re not a business, personal profiles can also switch over to a business account (without any changes to the front end of their profile).
If you’re not sure how to do this, here’s a quick guide on how to switch over to a business account.
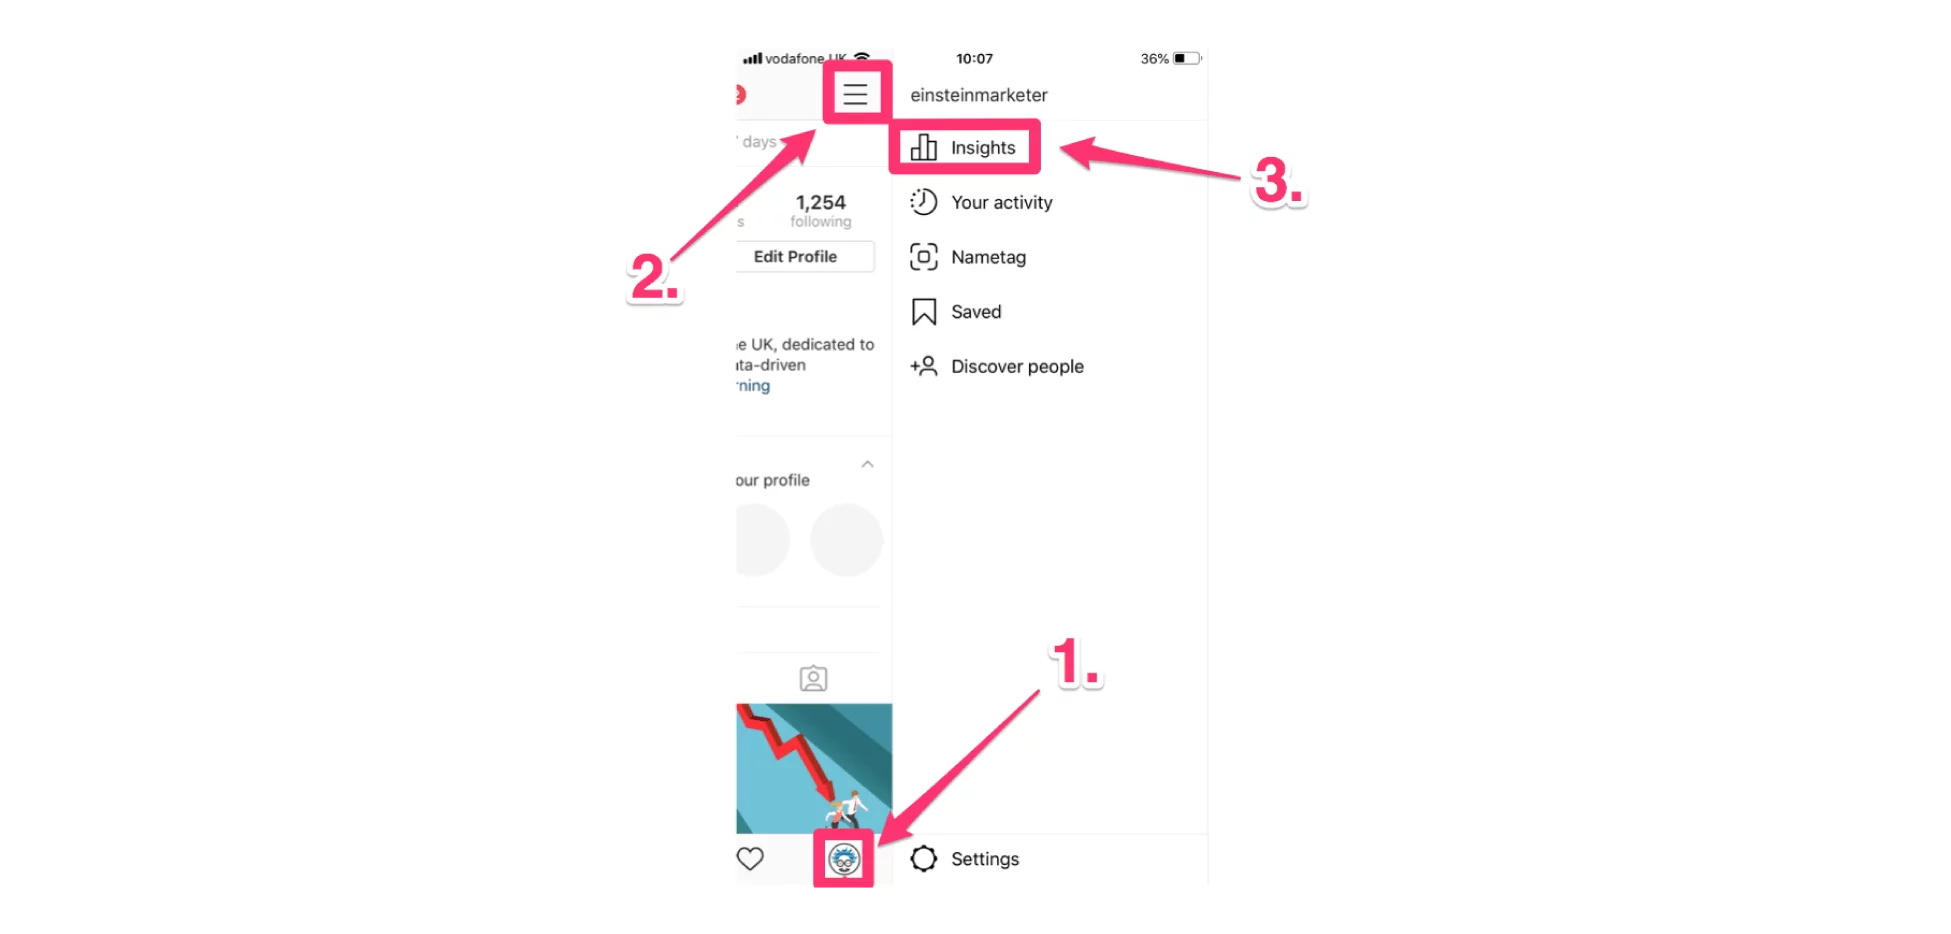
When you’re all set up with a business account, navigate to your profile, and hit the three horizontal lines in the top right corner. A side menu will open with an option called ‘Insights’. Click it!
And if that all sounds way too confusing, here’s a visual description:
 Cool, now that we’re all on the same page, let’s get some Instagram dirt under our fingernails.
How to identify your audience with Instagram analytics?
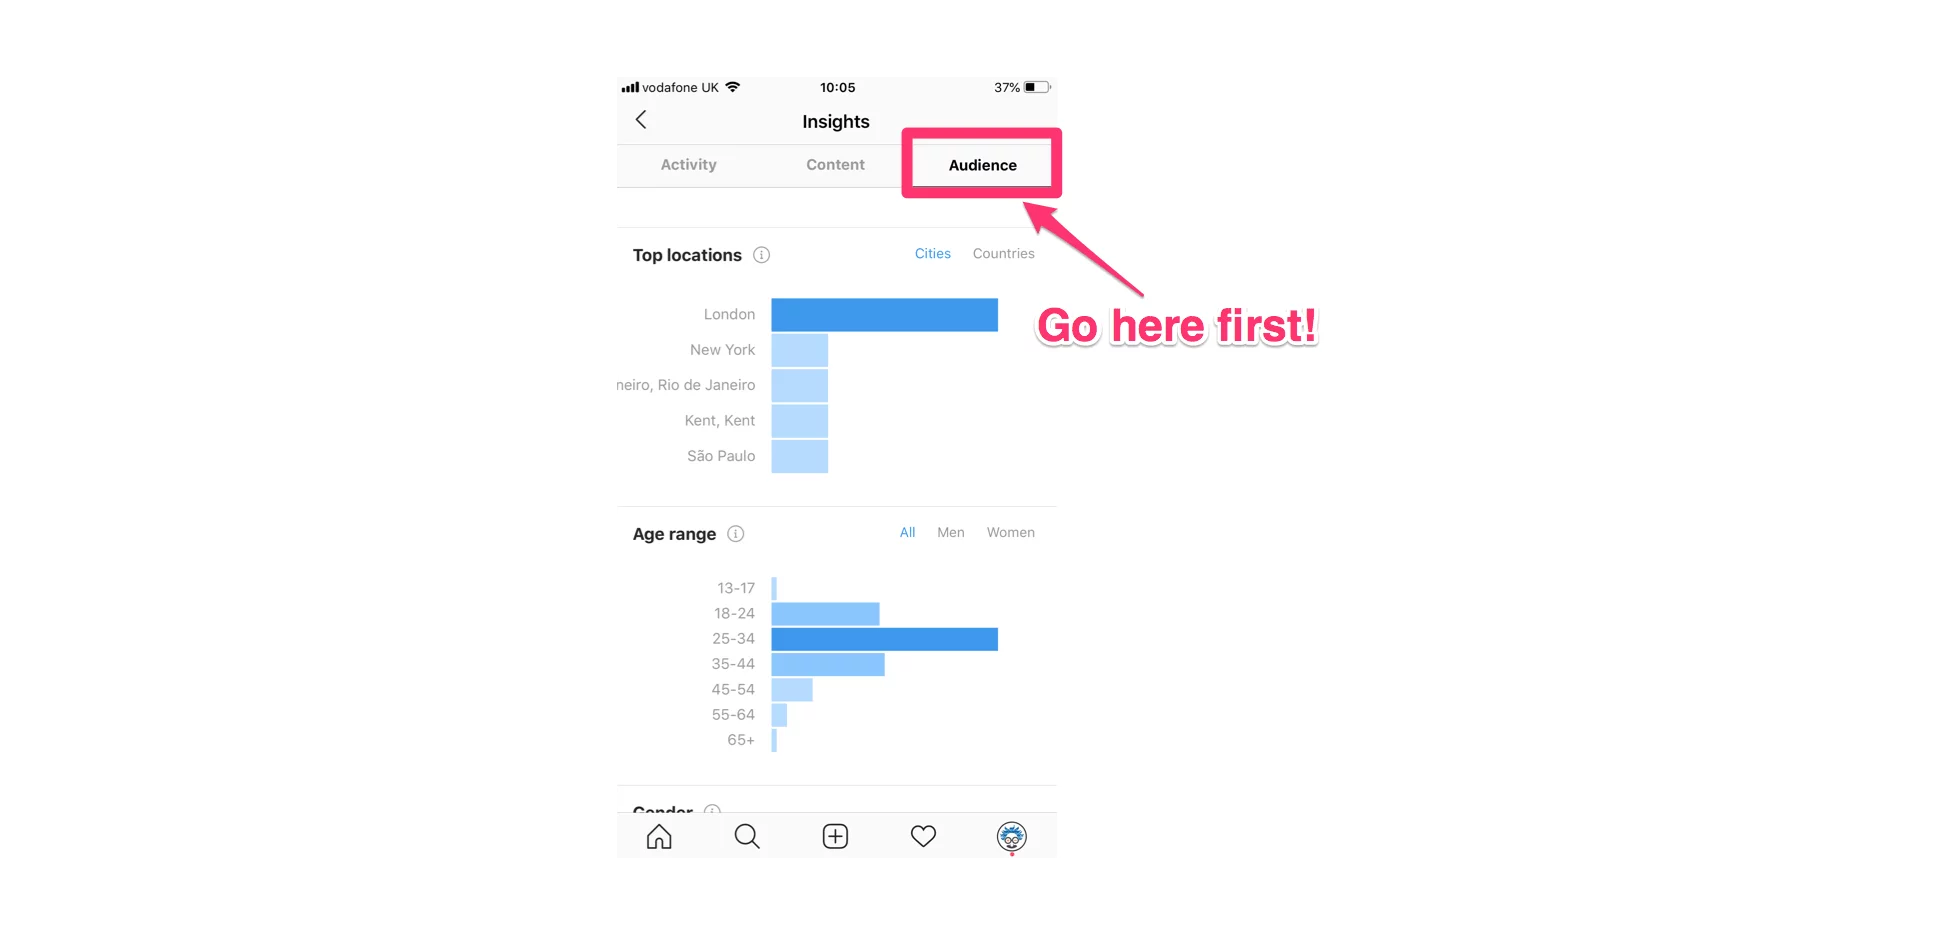
The second you hit that Insights button, you’ll be propelled into a world of data and numbers. Before you get too hung up on the KPIs (that you selected earlier), head over to the ‘Audiences’ tab.
 Understanding your audience is the first step towards Instagram optimization (no matter which KPIs you picked!).
The better you know your audience, the better you can serve them. The ‘Audience’ tab is a great place to discover, analyze, and hone your performance.
Under this tab, there are 4 different categories:
How to identify where your followers come from on Instagram?
The data held under this category reveals where your audience is concentrated. This is segmented into two categories, cities and countries.
 This data is easily breezed over, but it’s absolutely crucial to your performance.
The stats revealed can help you:
Schedule posts for specific times – think about the time zone of every location. If you’re hoping to expand your reach, you might want to schedule posts for peak times in the US. If you’re trying to build an engaged community, where are those people based? How can you best serve them?
Be relevant – if the majority of your users are in London (like the example above), what’s happening in London that your audience will know about? Creating location-relevant posts is a great way of driving engagement.
Optimize language and hashtags – if you’re hitting an audience based in a non-English speaking country and you’re having success, why not use hashtags in their native language? E.g. If you’ve got a Brazilian following who engage with your content (and niche), try some Portuguese hashtags to build on this.
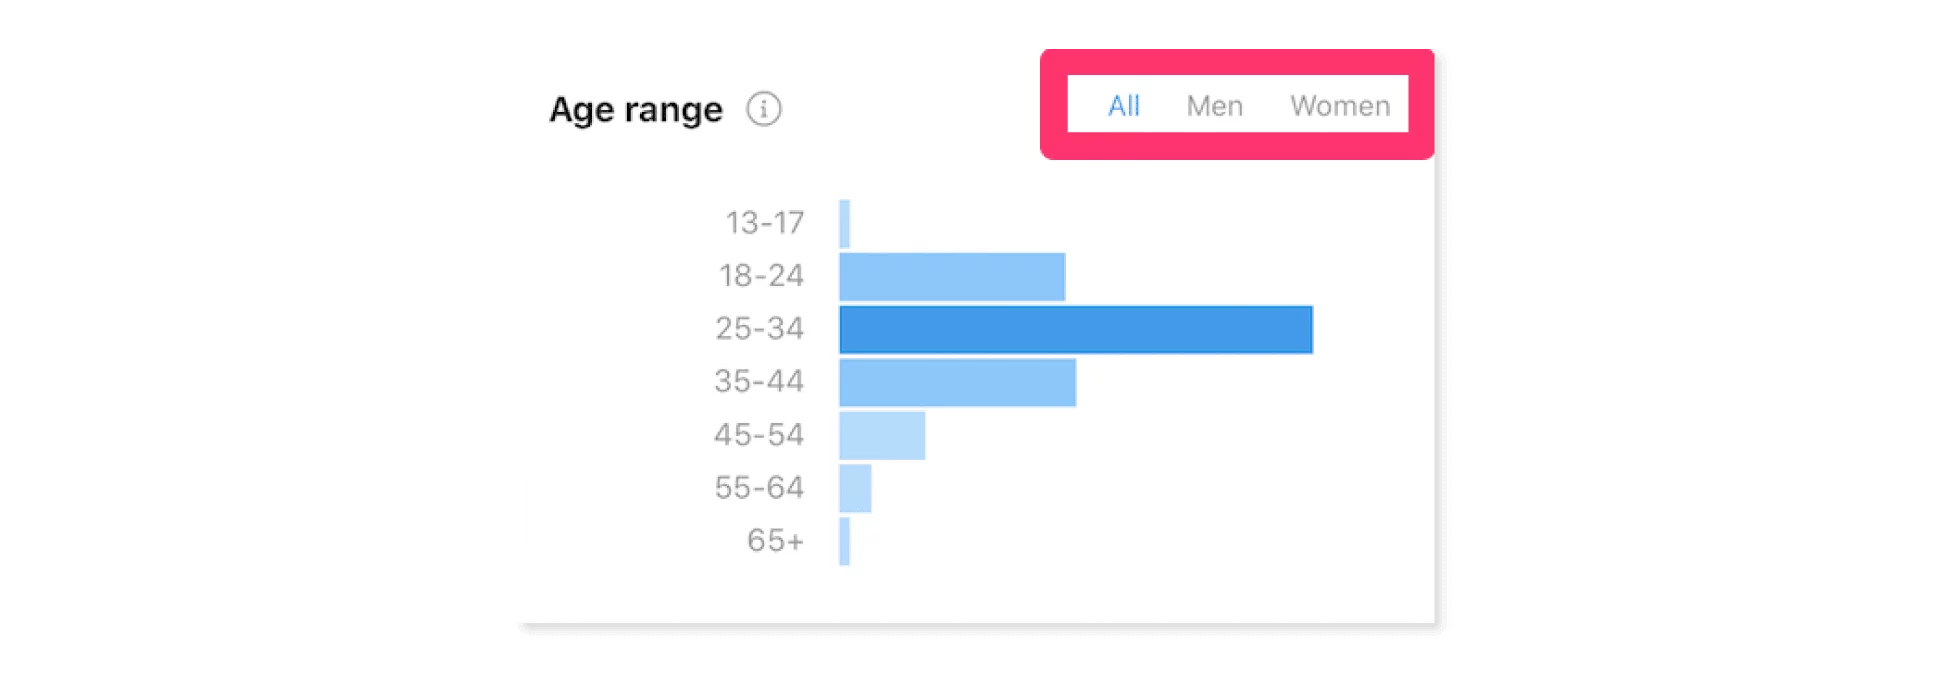
How to identify the age range of your Instagram followers?
As you’d imagine, the Age Range tab analyzes the age distribution of your followers. This can also be broken down into gender categories.
 Using this information, you can see whether and why your content is attracting your target audience.
This is especially relevant to those of you using Instagram for Business Growth. Think about the age range of people who are most likely to become a customer or lead, does this fit with your current followers’ age range?
Edit your content so it’s suited to the age of your target audience.
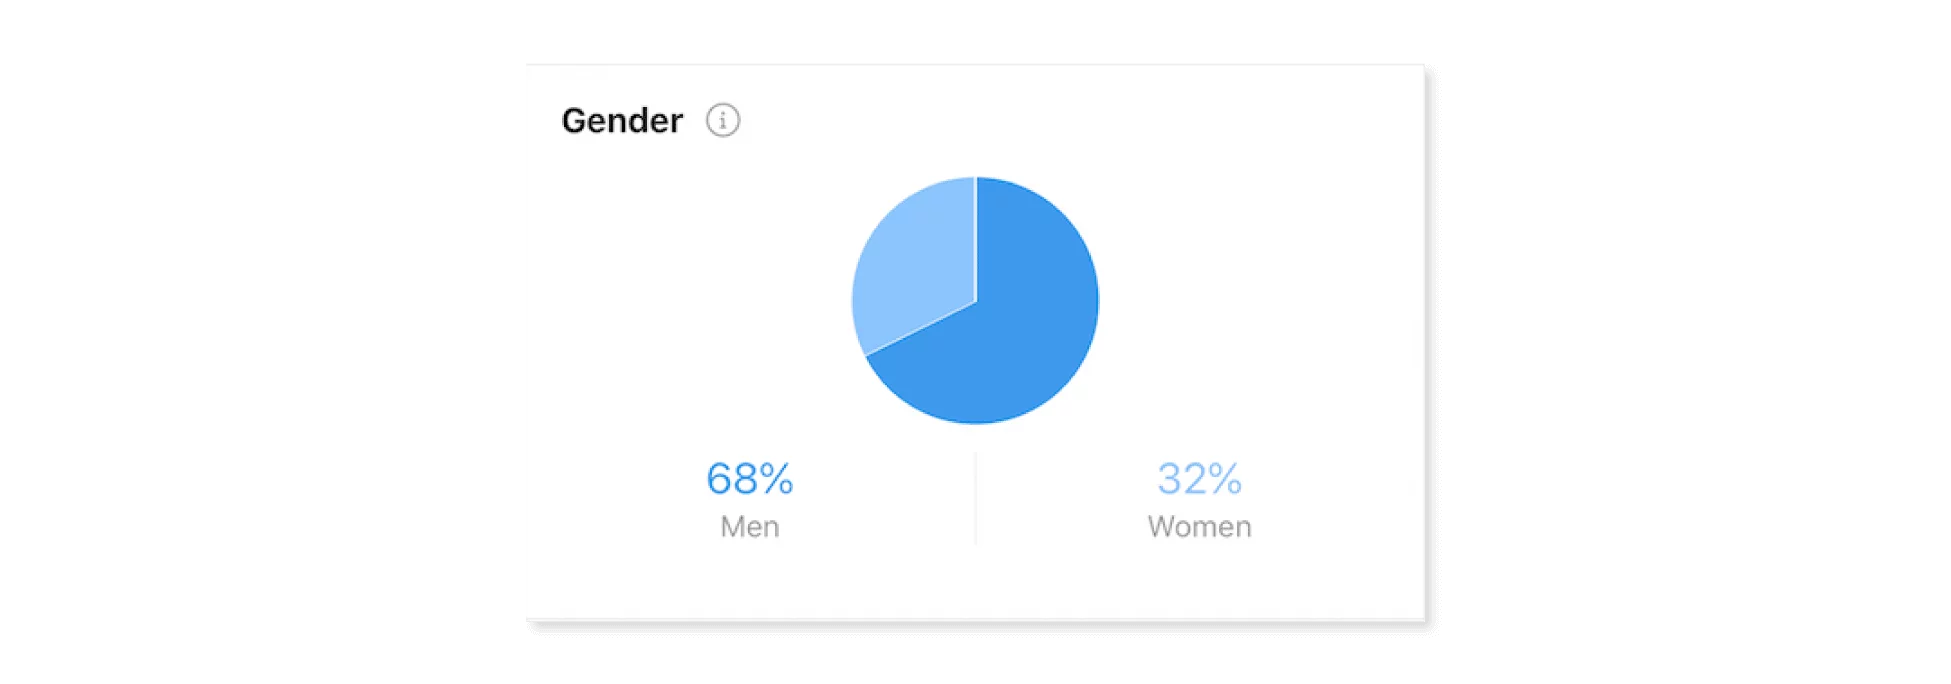
How to identify the gender of your Instagram followers?
This Audience tab categorizes by Gender and just like Age Range, it’s a great indication of whether you’re hitting the right target.
How to check when your followers are most active?
Unlike the other categories, Followers isn’t exactly what it says on the tin.
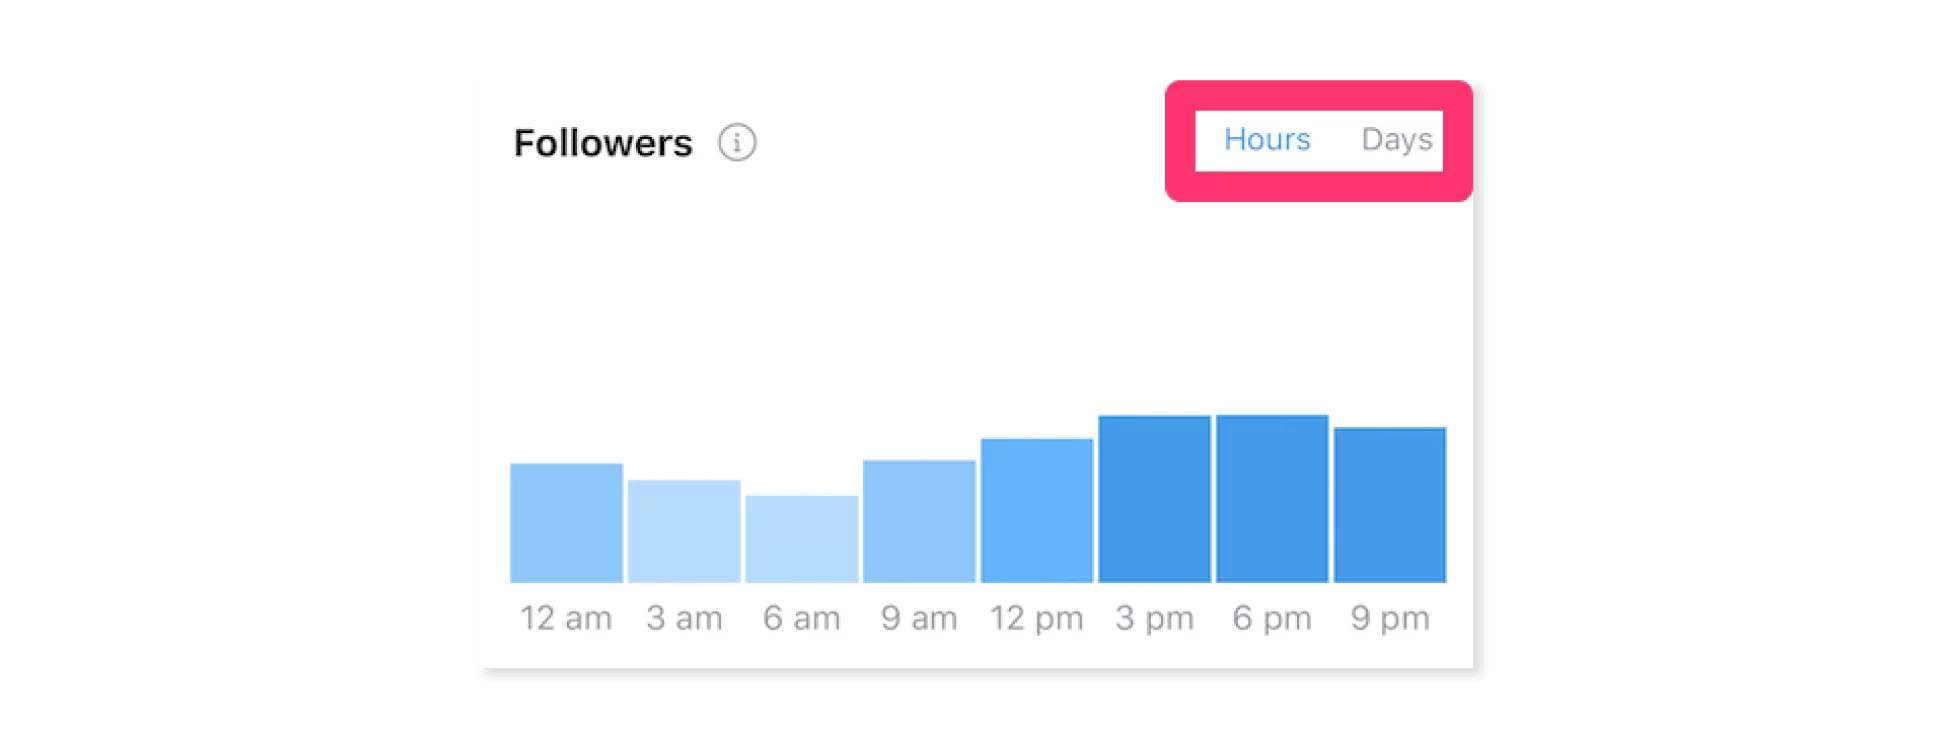
This category details when your Followers are active on Instagram, displayed in two categories, Hours and Days.
 This information is invaluable, use it to optimize in the following ways:
Post timing – if you want your posts to be seen in your Followers feeds, then you must post at the right time! Schedule your Instagram posts so they’re published 30-60 minutes before peak times.
Number of posts – a big mistake that we see all the time is over-posting. Niche and emerging brands with small audiences should not kill off their audience with 5 posts a day. Use the Followers category to plan posting quantity by week and day. Well-timed high-quality posts will have more impact than a blanket spread of weak content.
Understand your audience – the Followers data in the image above tells me that this is most likely a professional audience. They don’t use Instagram in the morning and their peak time is in the evening when they’re home from work. What does your followers’ most active time say about them? How can you adapt your content habits accordingly?
Your audience
By the end of this analysis, you should have a clear understanding of your Followers which will allow you to optimize your content.
For example, the data in the examples provided tell me that the majority of my target audience are professional men, working in London, aged between 25-34.
As a marketer, I need to get into the mindset of this target audience, and really think about content that would generate engagement, expand my reach or help me achieve my business goals.
Who is your target audience? How can you use this information to achieve your objectives?
If you’re one of the many people out there who is in shock about their ‘Audience’ analysis and is not hitting their target followers, stick around because we’re about to kick this Instagram Analytics guide into overdrive.
How to check Instagram analytics for your Instagram posts?
 Content is the driving force behind everything you do on Instagram.
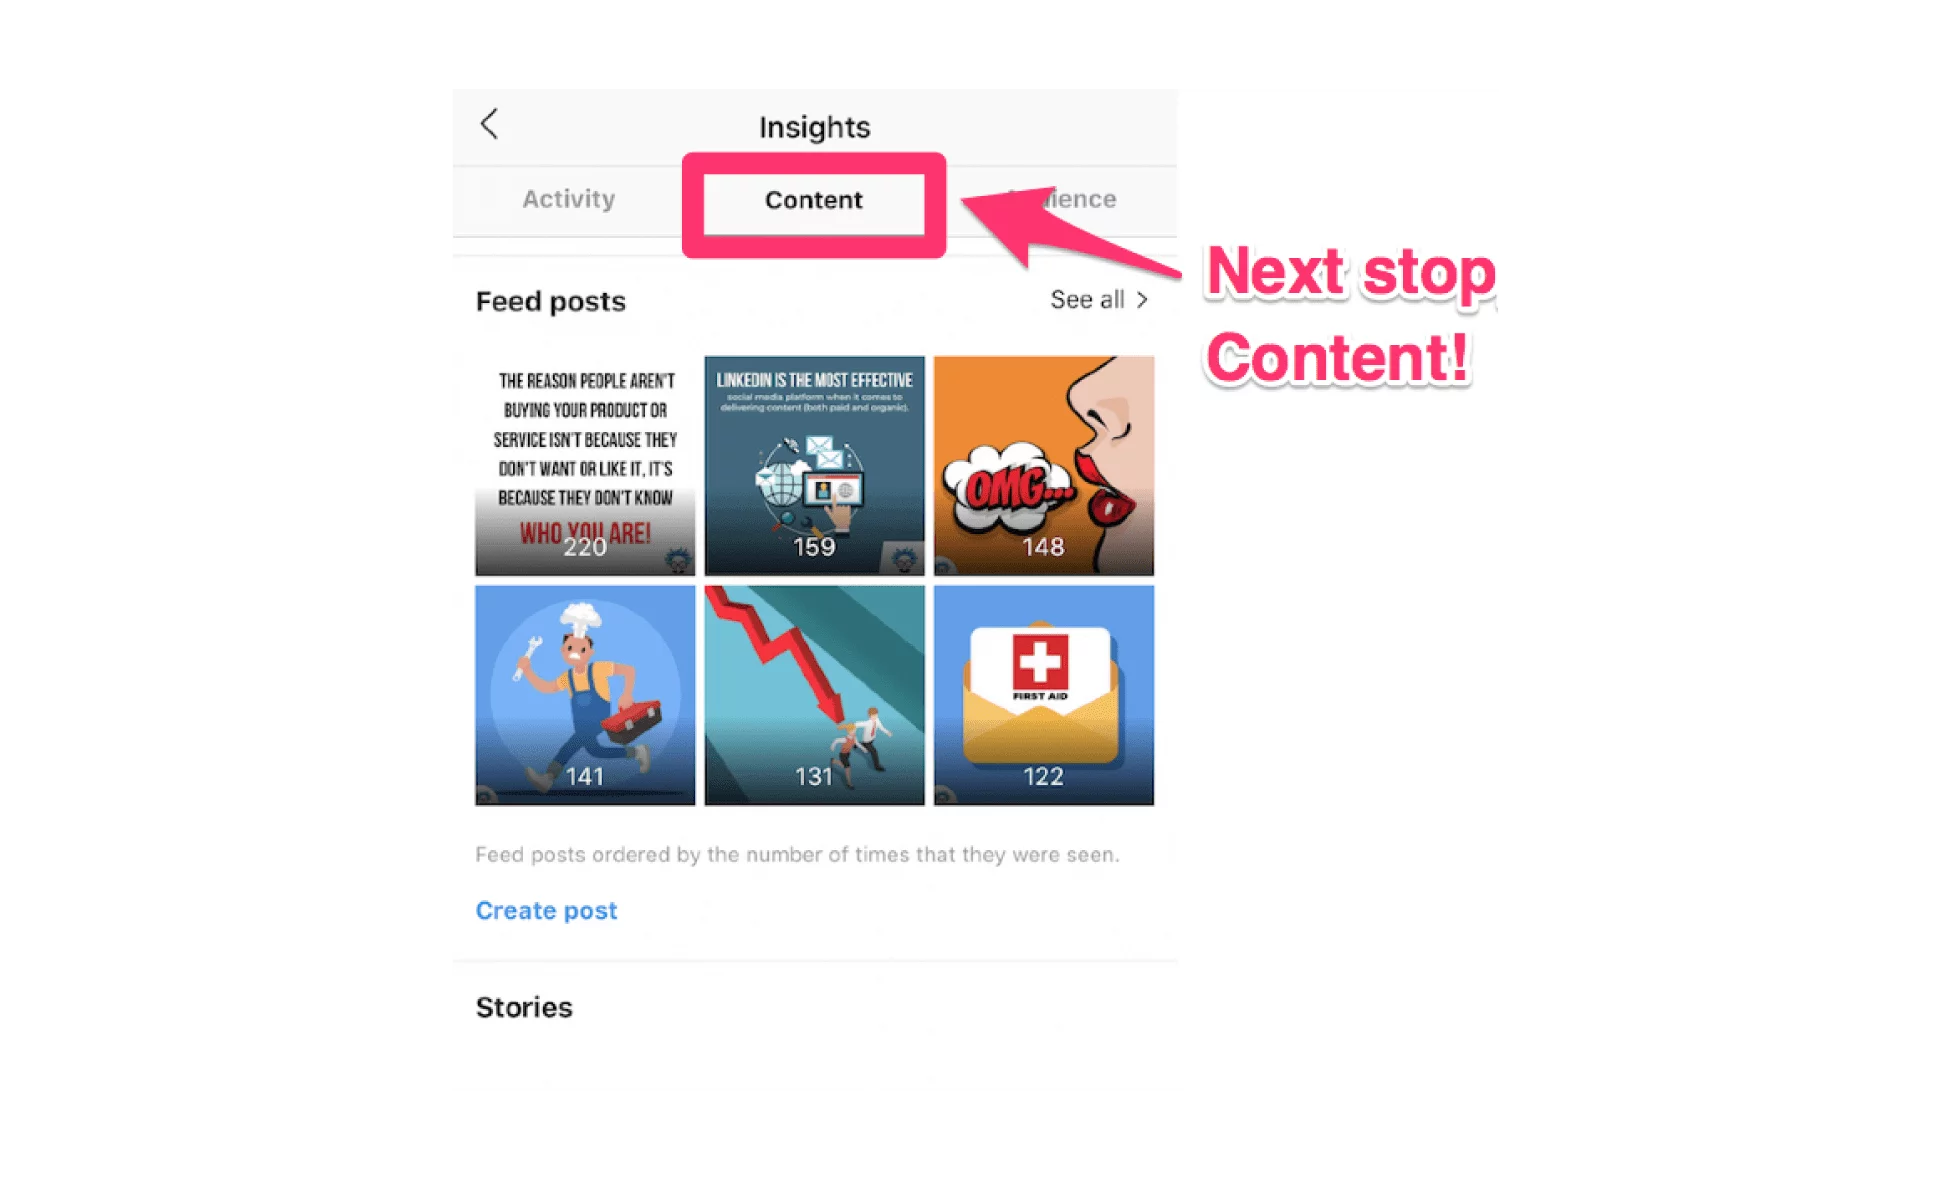
By using the ‘Content’ tab within your Instagram Analytics, you can see what’s attracting new people, engaging your existing audience, and helping your business grow.
Remember, it doesn’t matter what you think. You need to leave your opinions at the door. The content you create is not for yourself, it’s for your audience.
There are only two things that matter when analyzing Content:
- Your audience’s reaction (engagement, views, impressions, reach, actions)
- How their reaction relates to your objectives (measurable by your KPIs)
In the rest of this section, I’m going to explain how to navigate the Content category in your Instagram Analytics and show you how to optimize it…
…but, never forget those two factors.
They MUST be at the front and center of your entire Instagram analysis.
SEE MORE: 30+ Professionals Share The Best Hacks On Growing Your Social Media Brand
How to see the engagement rate of your feed posts on Instagram?
For the majority of you, Feed Posts will be your most valuable piece of content. They allow you to increase your impressions, engage your following, and move you closer to your goals.
Click on the ‘See all’ option and you’ll be linked to every post you’ve ever posted on Instagram.
When you’re here, click on the text at the top of the screen:
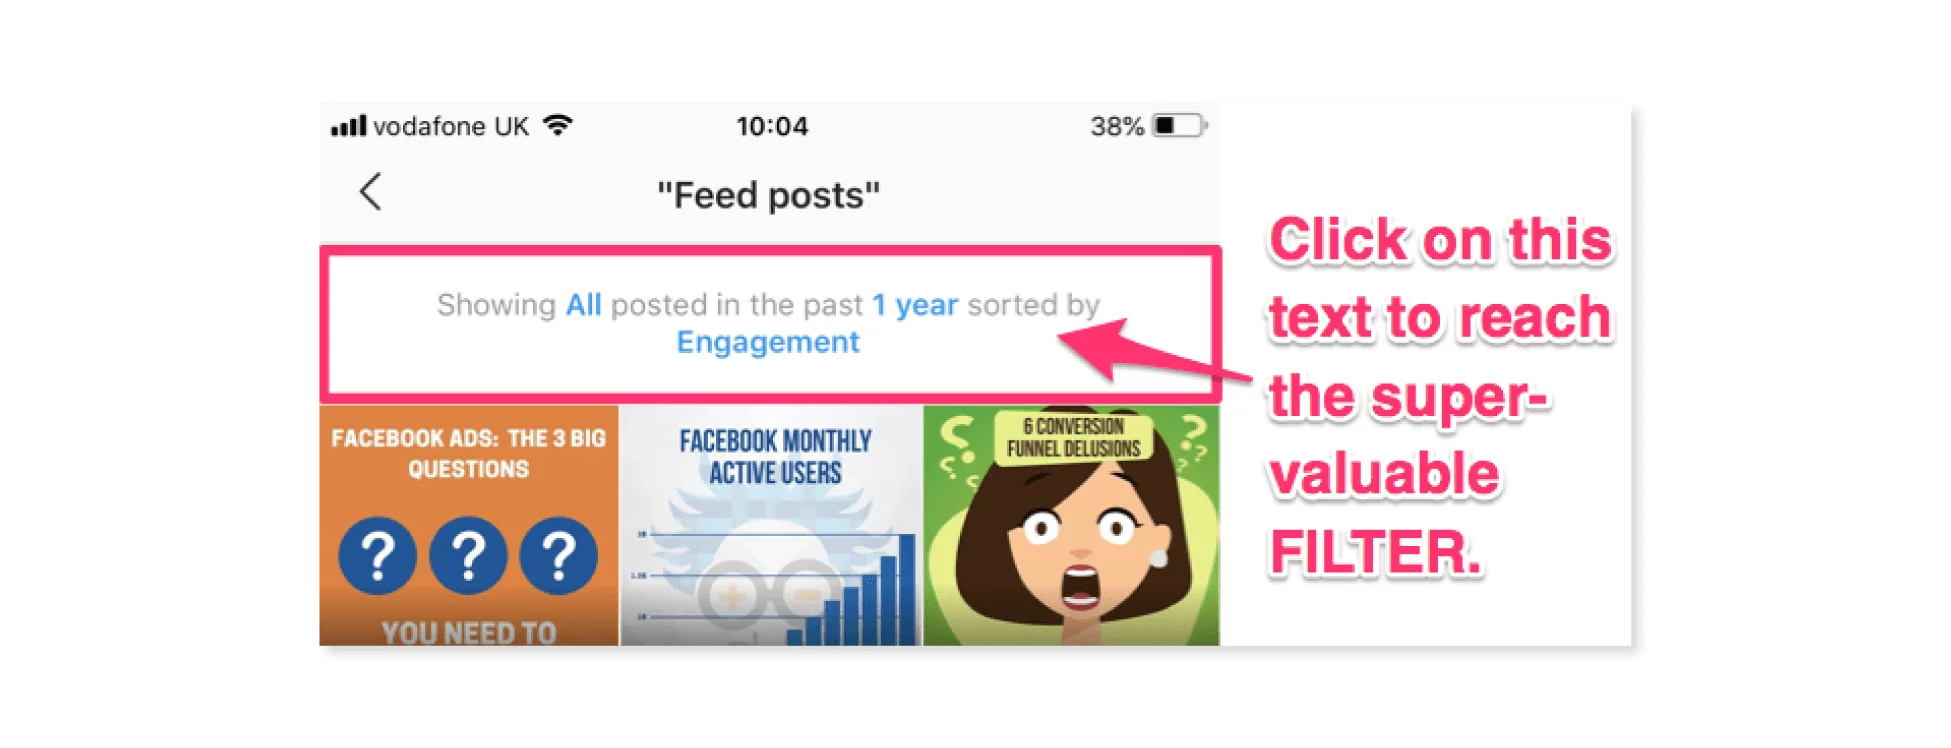
This will allow you to filter and order your posts by a range of different metrics, time frames, and post types.
I cannot stress enough how valuable this information is. There are almost limitless amounts of data that can be used to optimize your future posts.
At this stage, you’ll need to apply your KPIs to the FILTER. I wish I could go through every single metric on there (all 13 of them) and explain each one, but we’ll be here for another 4 hours!
When you’ve filtered your results, analyze the top-performing according to your objectives. Why have these done better than everything else? Can you replicate their success? How does this content tie into your target audience?
If you know the answers to these questions, awesome. If you’re unsure or you’d like to know more, dig a little deeper. Click on the top-performing post. Underneath the image, you’ll see a blue button called ‘View Insights’.
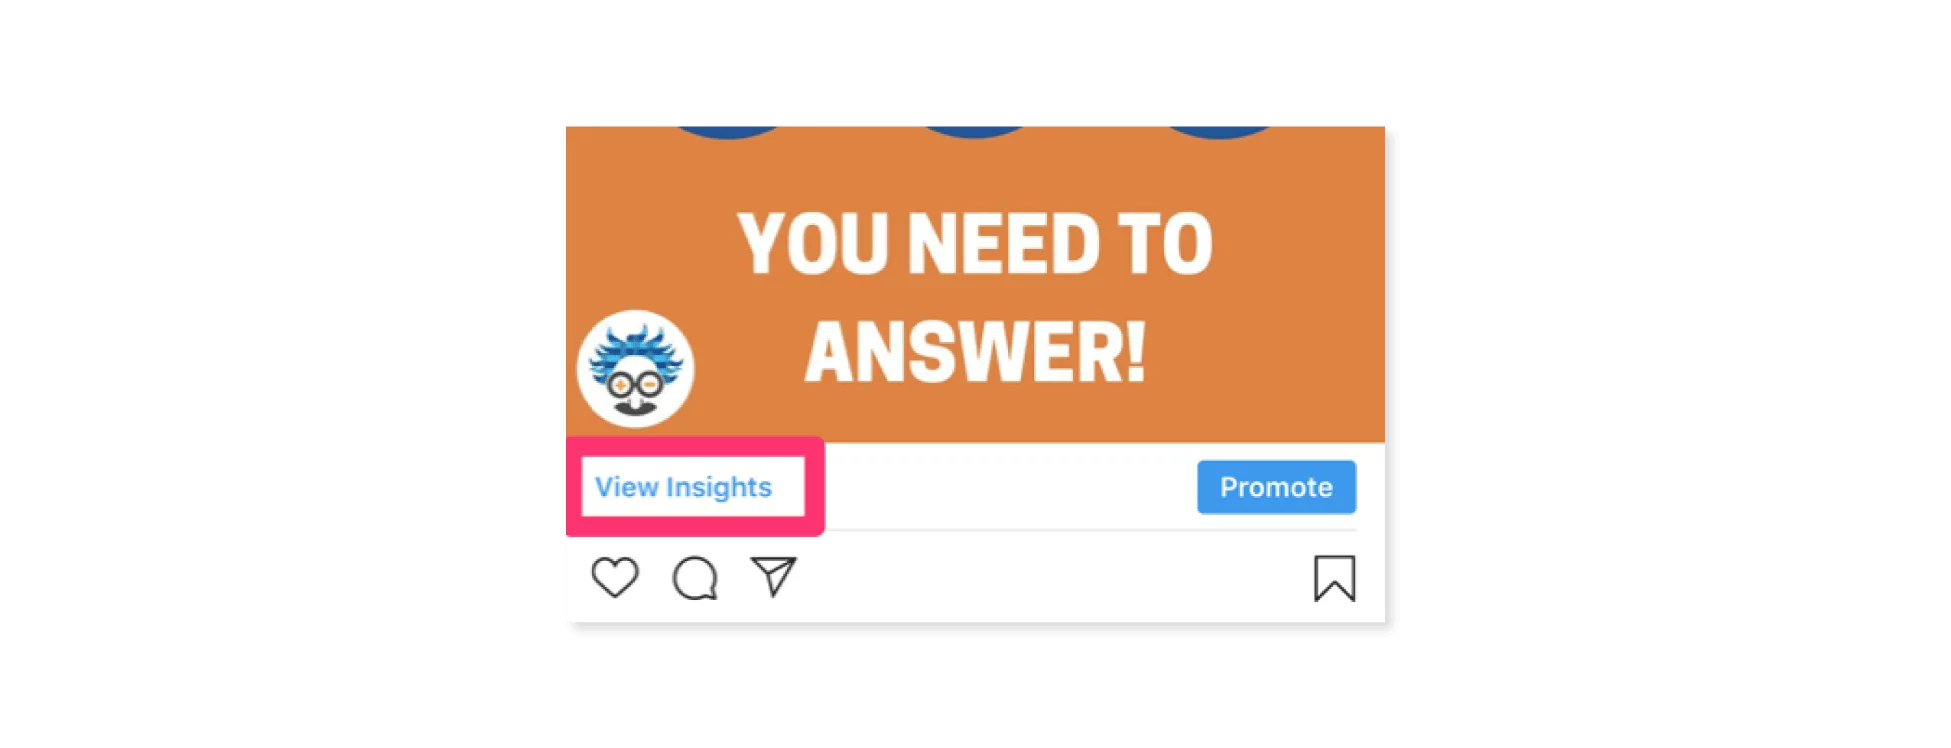 A bar will come onto the screen, swipe it up. This will reveal the full analytics for the post.
Within this data you’ll see:
- Engagement (likes, comments, direct messages, saves)
- Interactions (actions taken from the specific post)
- Discovery (follows, reach and impressions, broken into home, hashtags and from profile)
If you’re aiming for Growth, keep a close eye on the Impressions tab at the bottom of the post, especially Impressions ‘from hashtags’.
Hashtags are one of the greatest ways to grow your following and increase your impressions (especially now that Instagram allows users to follow hashtags). You should be using different hashtags for every post you publish (if you don’t want to get banned and you’re serious about expanding your reach).
Use the impressions ‘from hashtags’ filter to see which ones are working for you. If you’d like to learn more, check out my guide, How to Use Instagram Hashtags (and How Not to).
How to see Instagram analytics for your Instagram stories?
Instagram Stories are used by over 250 million Daily Active users, making them a great place for brands, regardless of their social media objective.
Stories are only shown to your existing audience, making them a tough place to aid growth, but hashtagged text can be added to images, which makes them discoverable to people who follow hashtags.
Whatever your opinion, the use of Stories is on the rise. It’s a great place to keep your audience engaged and prevent unfollows (the first step to growth is keeping your current audience and building upon them).
The analytics side of Stories reveals a ton of interesting facts that you can use to define the direction.
Navigation is exactly the same as Feed Posts, so to prevent repeating myself, check out the section above if you’re lost!
Just like Feed Posts, it’s crucial you keep your most important KPIs at the forefront of your analytics. So, make sure you use the super-valuable FILTER in the same way as above.
How to Sort analytics for Instagram stories by type?
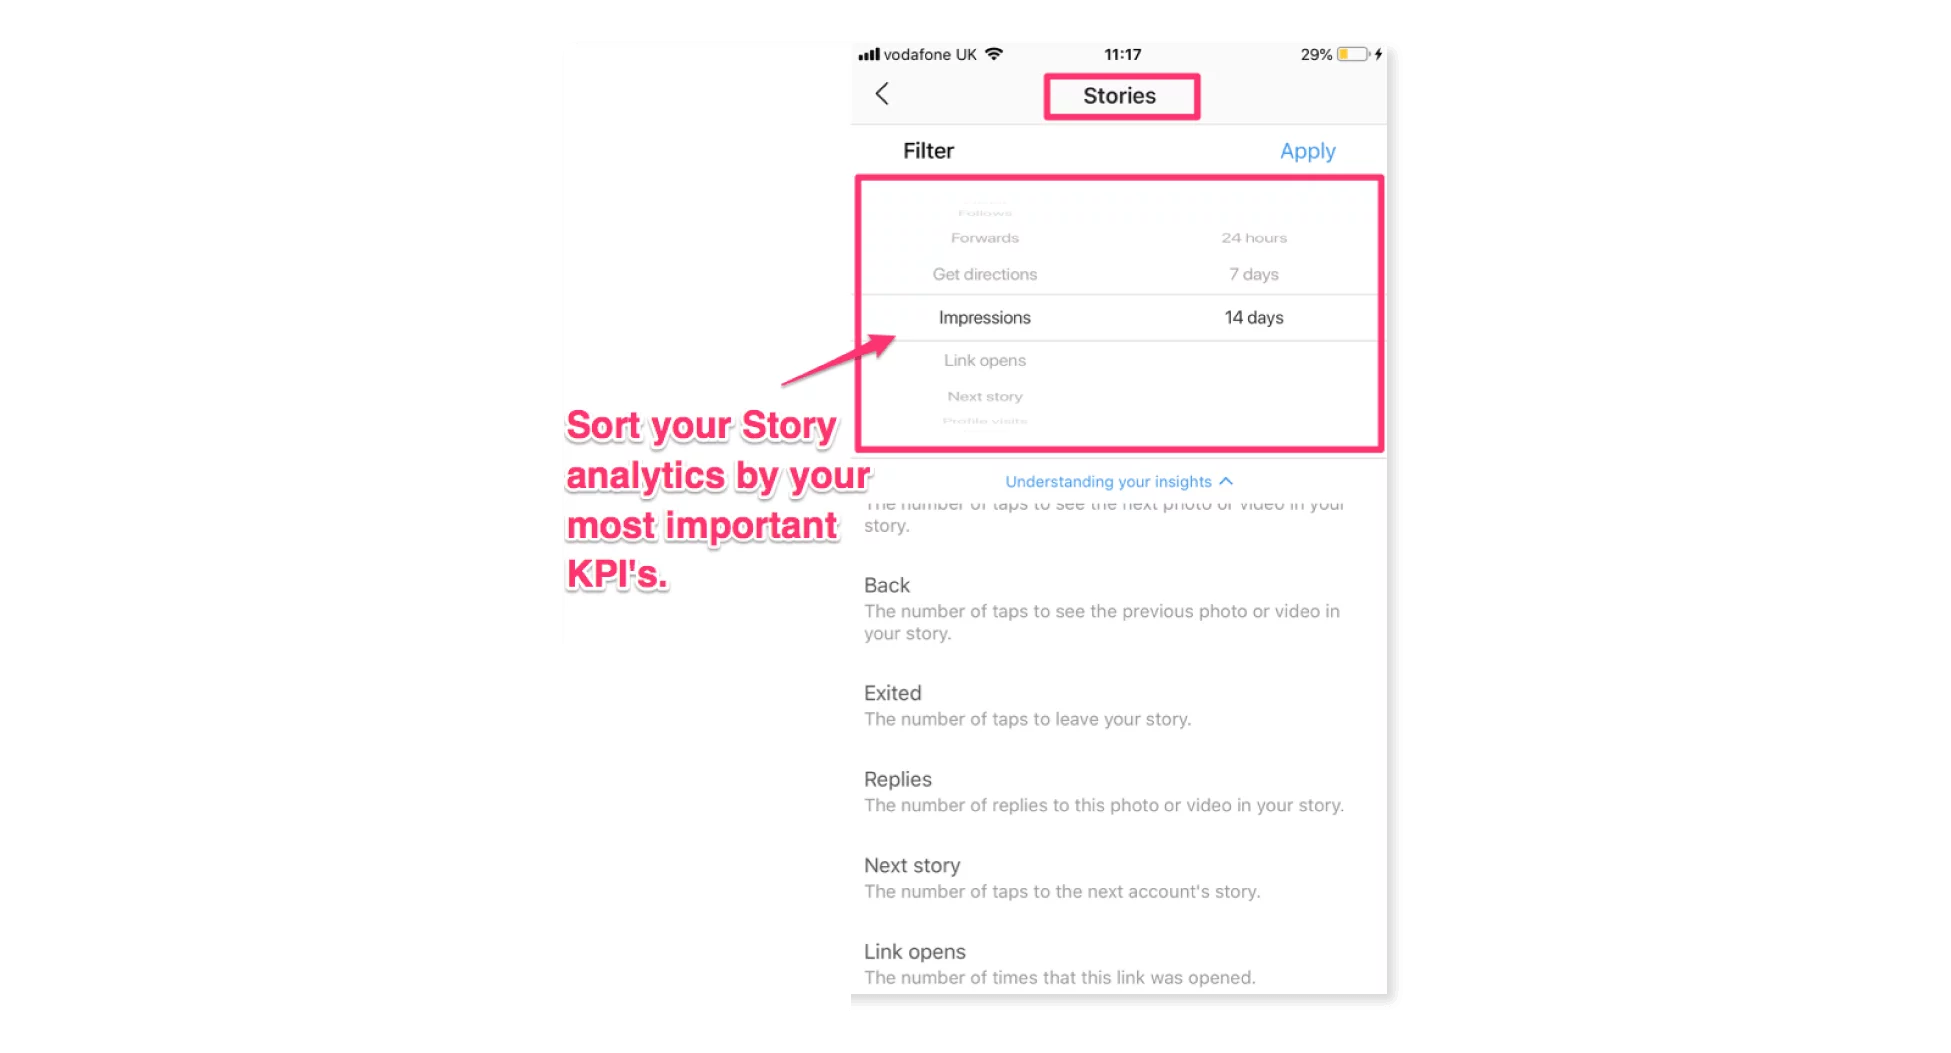 Now, into the detailed stuff.
The first thing you want to do is test the number of posts you publish to each story and measure the analytics against this.
For example, what amount of posts sees the smallest drop off in numbers? Are you holding your audience through an entire 15 post story? Or are you better off with 6?
Test your story length over the course of the next week and analyze this against the drop-off in views. Too many posts in your story can lead to unfollows.
When you’ve Filtered your stories by your KPI’s, click on your highest-ranking content and look at the individual insights of each. Scroll to the bottom of these analytics for a detailed view of their success at engagement generated.
How to See the results of your Instagram stories?
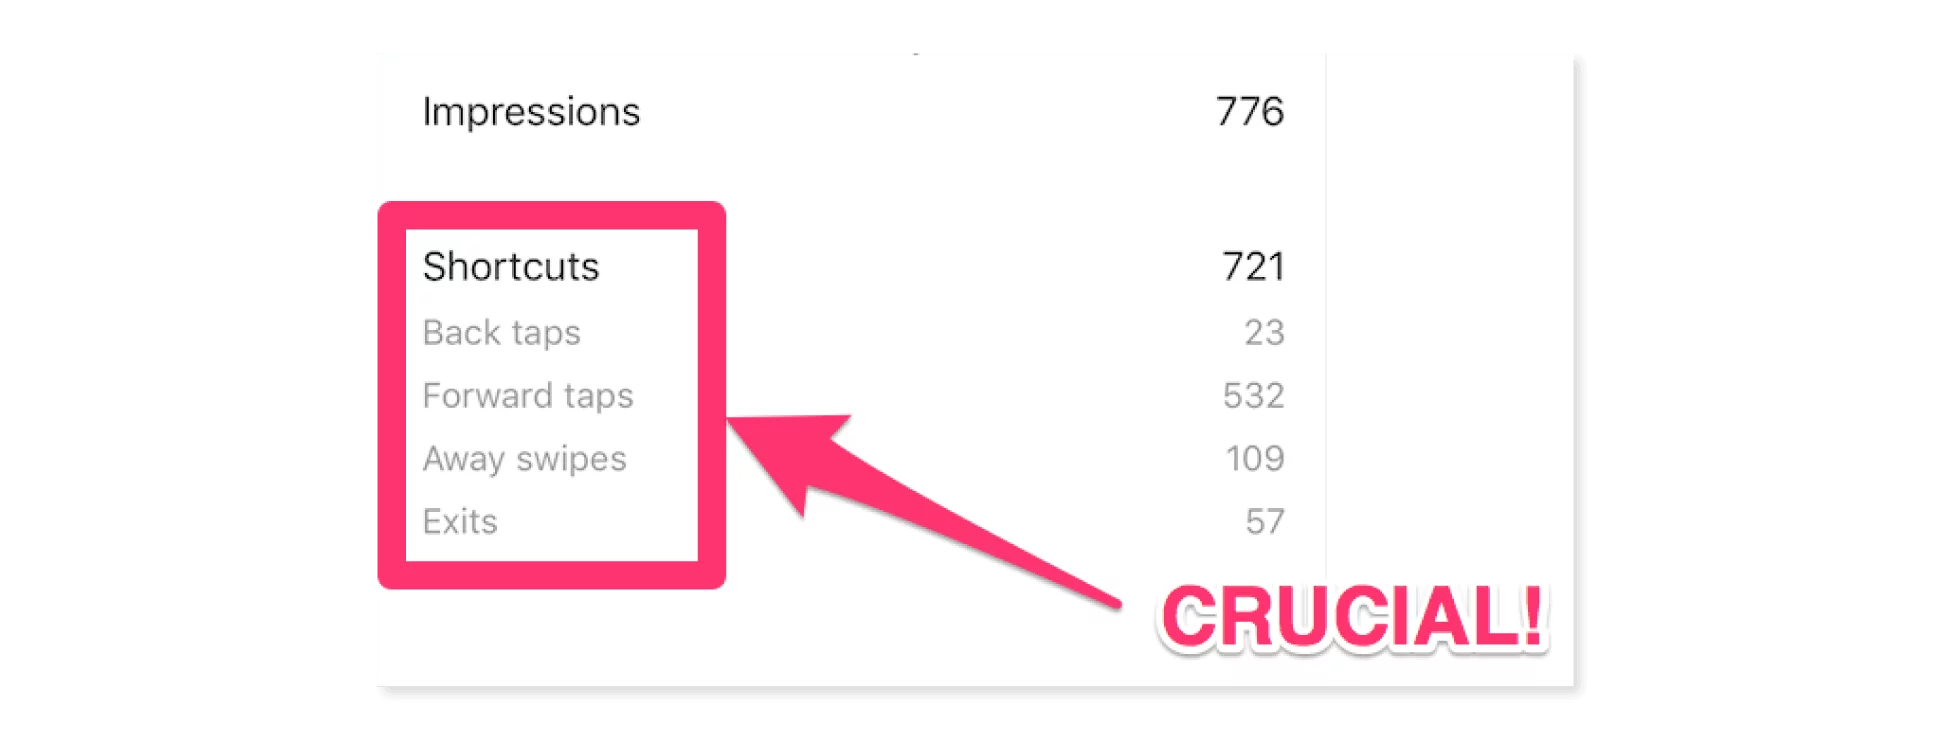 The four metrics under the ‘Shortcuts’ tab gives us a ton of super-valuable information about the success of our stories.
Back Taps – This is when people tap back to re-watch a segment (or segments) of your story. This is a great KPI for those of you seeking to engage a community of followers. The more back taps you receive, the more people are loving your Instagram stories!
Forward Taps – If followers are tapping forward to skip your story, they’ll show up here. A high Forward tap rating tells you that your stories are not engaging your following and that they’re keen to skip to the next segment.
Away Swipes – A follower can skip ahead to the next Instagram story (away from yours) by swiping right. This is another clear indication of how well you’re engaging your audience. The lower your away swipes, the better!
Exits – This metric displays the number of people who have exited Instagram Stories altogether, whilst on your story post. Both Exits and Away Swipes are numbers that you want to keep as low as possible.
Your most successful story posts will normally be the first post of the day. Analyze your most engaging stories, and measure their strengths. Ask yourself, what content is keeping your audience engaged the longest (throughout entire stories)? What is your optimum number of story posts? How can you replicate this success without regurgitating the same content over and over again?
How to see Instagram analytics of your promotions (paid ads)?
The category at the bottom of your Content analytics is called Promotions, and it displays data from your Instagram ads and boosted posts.
If all you’re doing is hitting the ‘Boost Post’ button within Instagram, you’re missing a massive trick.
Instagram is owned by Facebook, who (arguably) have the best digital advertising platform anywhere. Those of you who are running ads on Instagram should head over to Facebook Business Manager to organize your Insta ads.
From here you can target specific audiences, prime your boosted posts to meet certain targets, and review in-depth statistics about your ads.
Promotions is a good place to quickly check the performance of your ads, but if you’re serious about making your money pay, use Facebook’s Business Manager.
SEE MORE: Never Run Out Of Content Marketing Ideas With These 13 Methods
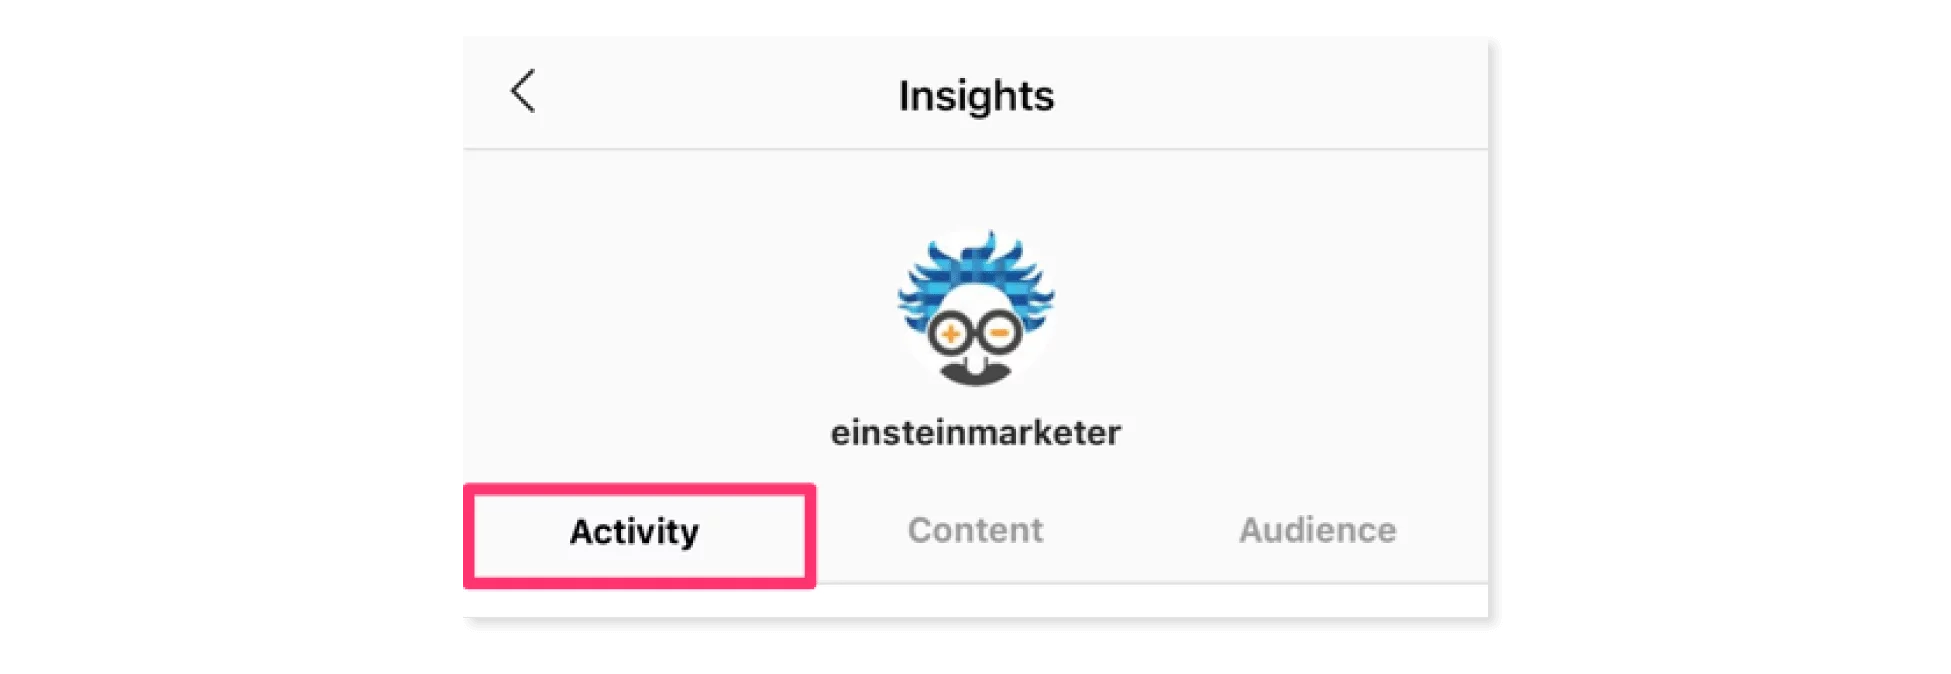
How to check the activity in Instagram analytics?
The last (and least valuable) tab within Instagram insights is ‘Activity’.
 This category gives you access to two sets of information, Interactions, and Discovery.
Whilst Activity is a great place to track your performance and keep a close eye on a few of your KPIs, we can’t learn as much from this data as either Content or Audience.
How to track interactions using Instagram analytics?
Within this tab you can track the actions taken on your account over the previous 7 days.
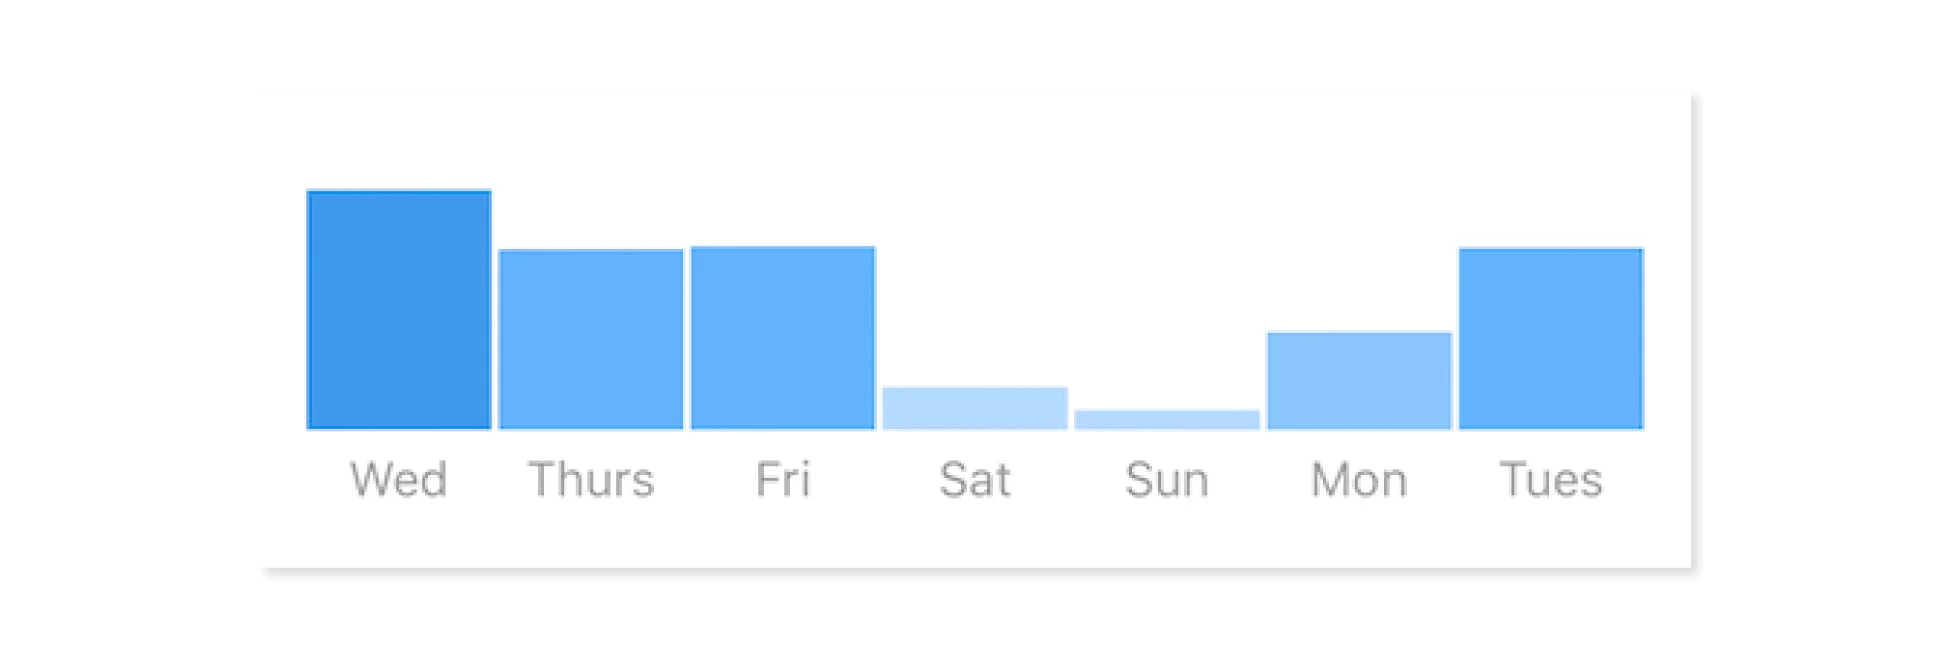
The most valuable part of this section is the breakdown by day of the week.
This info is particularly useful for those of you seeking Business Growth from Instagram. You can measure the totality of ‘Profile Visits’ and ‘Website clicks’ by day of the week, giving you direction for future posts and scheduling.
 This graph tells us that this account’s following do not take action on a weekend, and are much more tuned into the content’s message on weekdays. We would use this data to optimize our posting schedule!
SEE MORE: [FREE TEMPLATE] Why Your Social Media Proposal Isn’t Getting Results
Discovery
Just as Interactions is great for those of you seeking Business Growth, the Discovery data is a place for tracking Instagram growth.
This data comes in two sections, Reach and Impressions.
Reach – the number of unique accounts who have seen your posts.
Impressions – the number of times your posts have been seen.
Use this information to quickly track the overall performance of your Instagram strategy and the content that you’ve posted in the previous week.
Discovery also comes with a 7-day daily breakdown (by reach). This information can help you formulate scheduling tactics.
 This data SHOULD correlate with your Audience analytics. Tie these together to create the perfect scheduling program.
SEE MORE: 30 Marketing & Social Media Podcasts Any Professional Should Listen To
Instagram analytics: a must-have for your brand
This is the comprehensive guide to Instagram Analytics and more specifically the Insights option for business accounts…
…but, there’s so much more you can learn.
There are a number of incredible Instagram Analytics tools that can help you dig even deeper into your performance.
Data is crucial when forming a direction for your Instagram strategy. When you have a clear idea of your objectives, these figures transform from simple numbers into invaluable messages.
If you’re serious about Instagram, make sure you’re using them to their full potential. Bookmark this guide, or favorite the link, because it has everything you need to get started.
Good luck!
Oh and let me know what kind of Instagram analytics tools you’re using. What would you recommend?
If you’re interested in reading more, check out these awesome resources
- 7 Brainstorming Techniques That Will Keep Your Social Media Content Flow Steady
- The Beginner’s Guide To Becoming A Badass Digital Marketing Freelancer
- Essential Guide To Performing A Social Media Competitor Analysis

Josh is Content Director @Einstein Marketer, previously a Content Manager, freelancer, and marketer. He writes, edits, proofs, and strategizes content, sharing the most successful tactics with Einstein’s lovely audience.
